Project lead
understand users' needs, behaviors, and experiences
Figma, Confluence, Dovetail, Informizely, Clarity, GA
3 months
Challenge
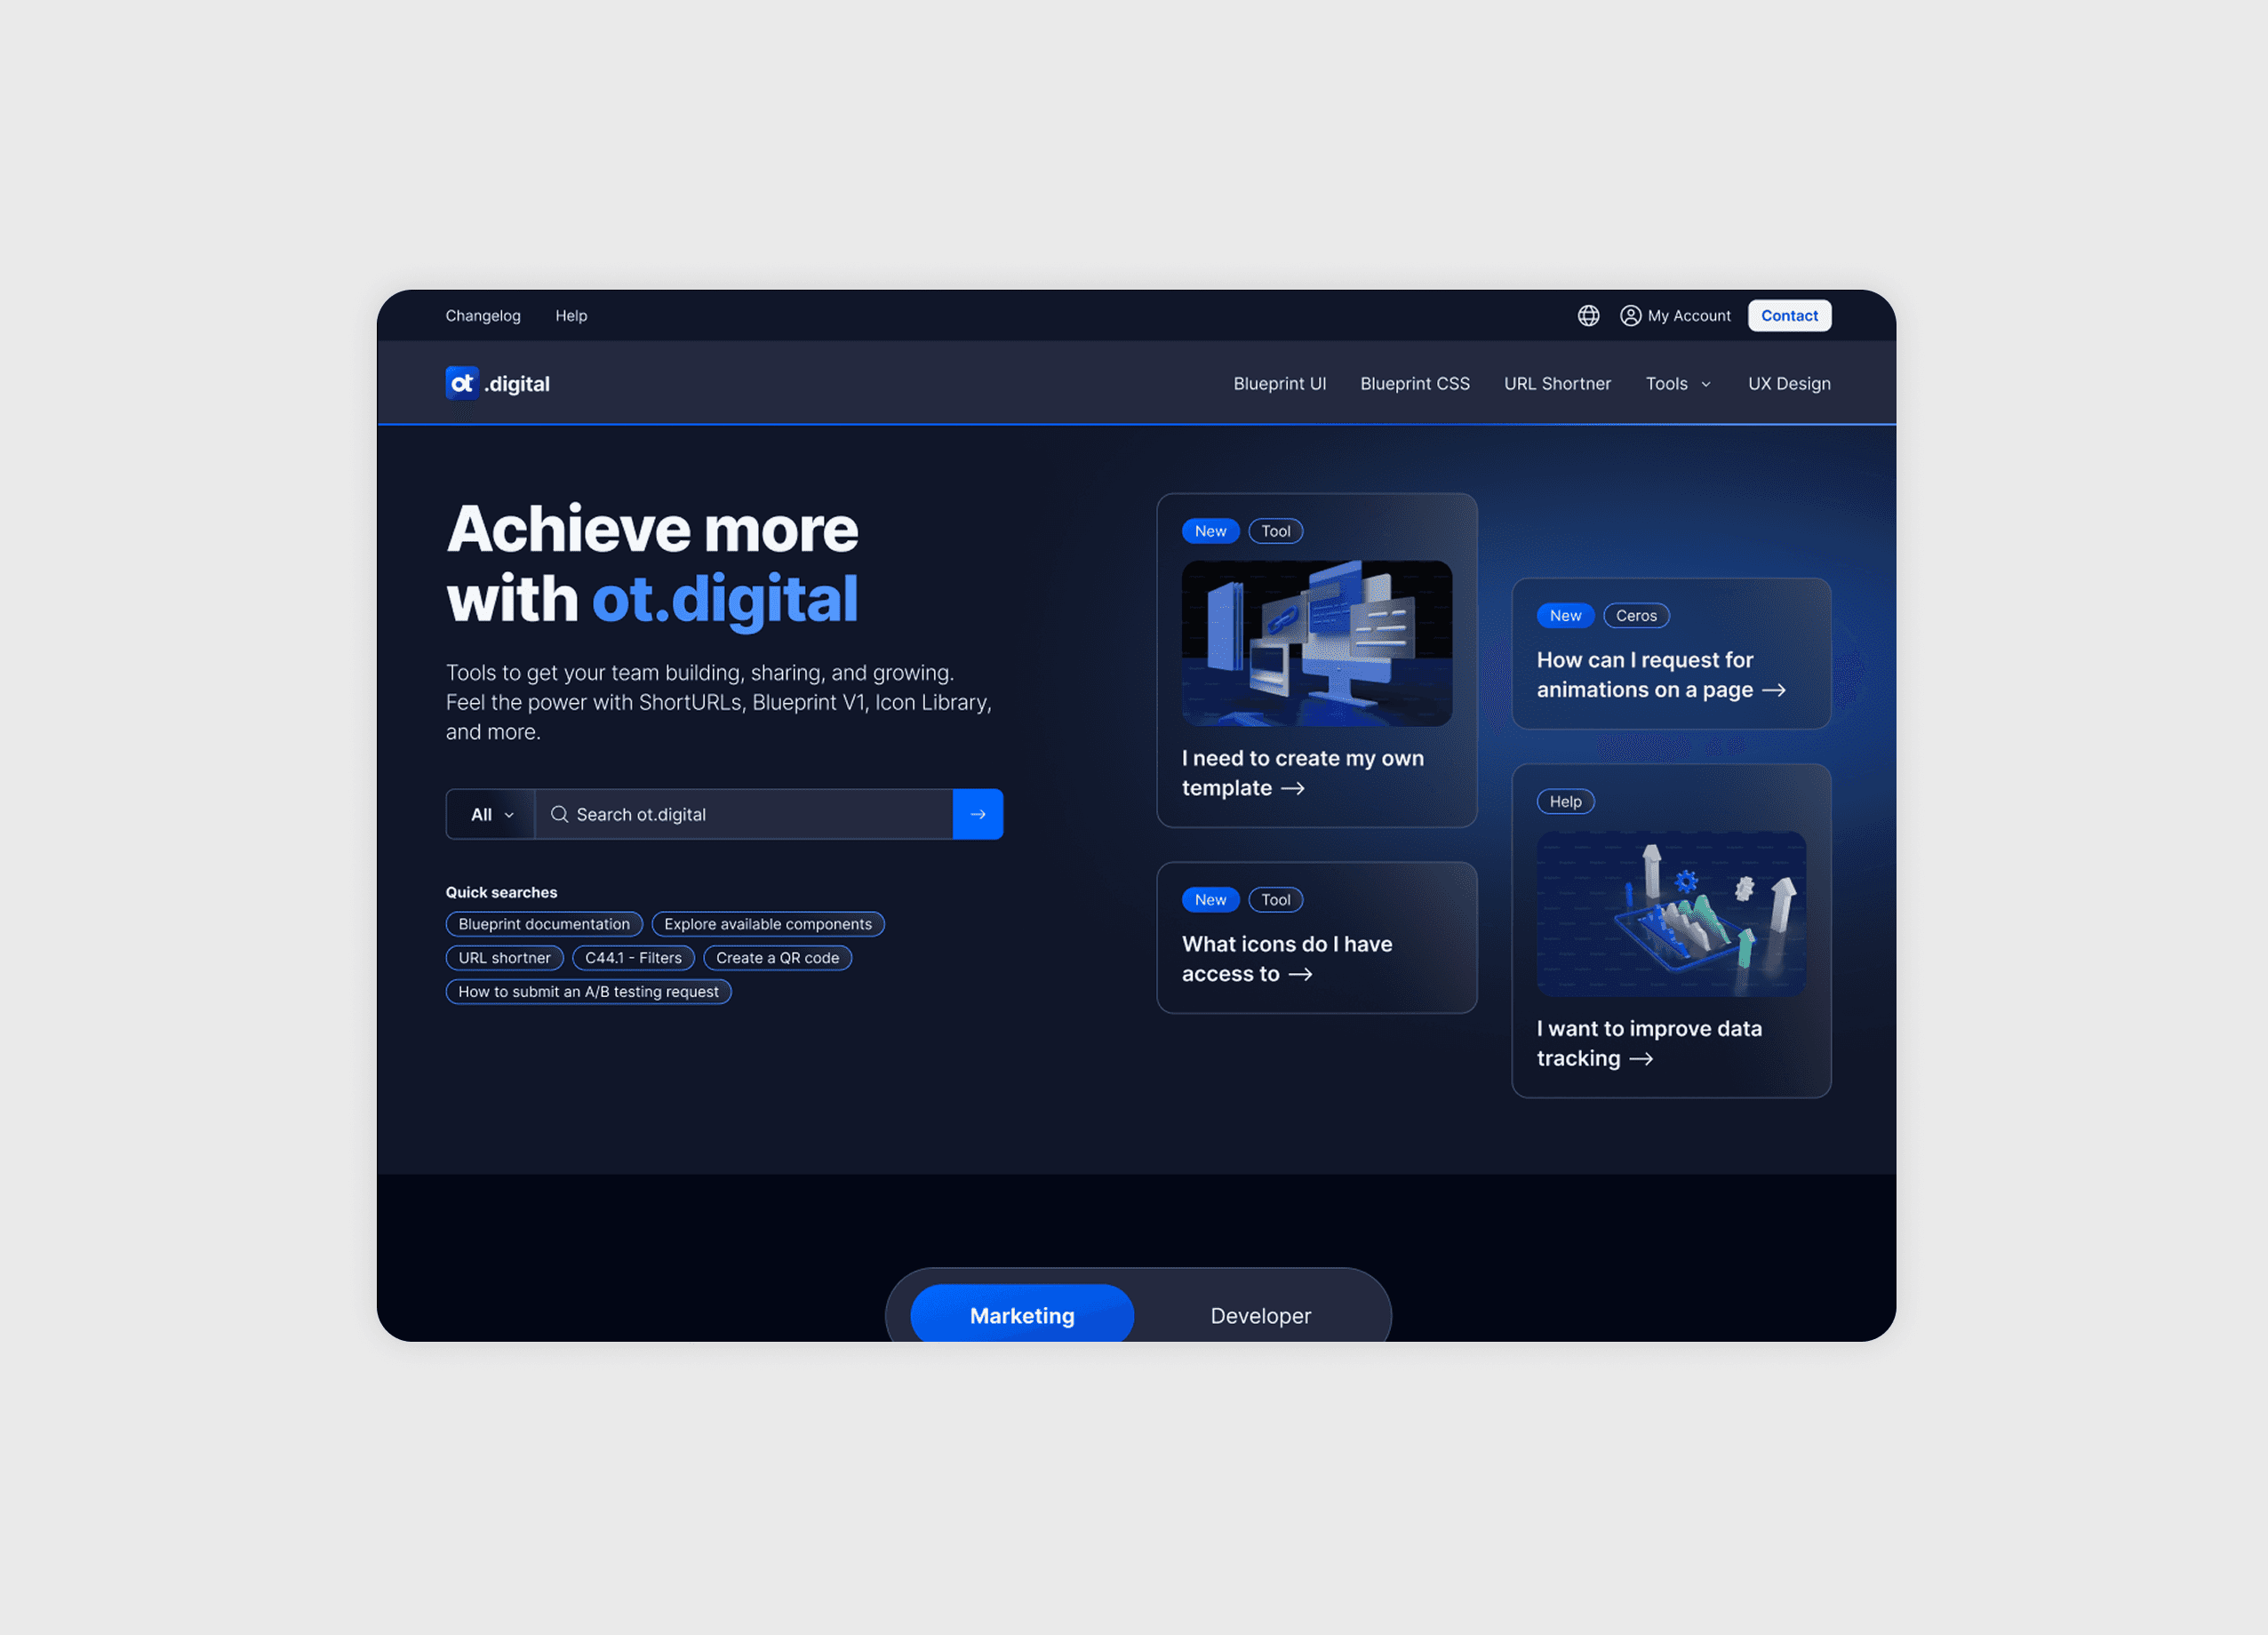
Following the successful launch of our new website, we have transitioned from the initial pre-launch UX research phase to the next phase of enhancing the website’s layout and overall user experience. One of the primary challenges were recruiting participants and selecting the appropriate tool to optimize and compile the findings and build the report.
Beside the limited budgets and resources, we had to put effort in convincing stakeholders of the value of UX research. We made a lot of preparation and planning focusing on:
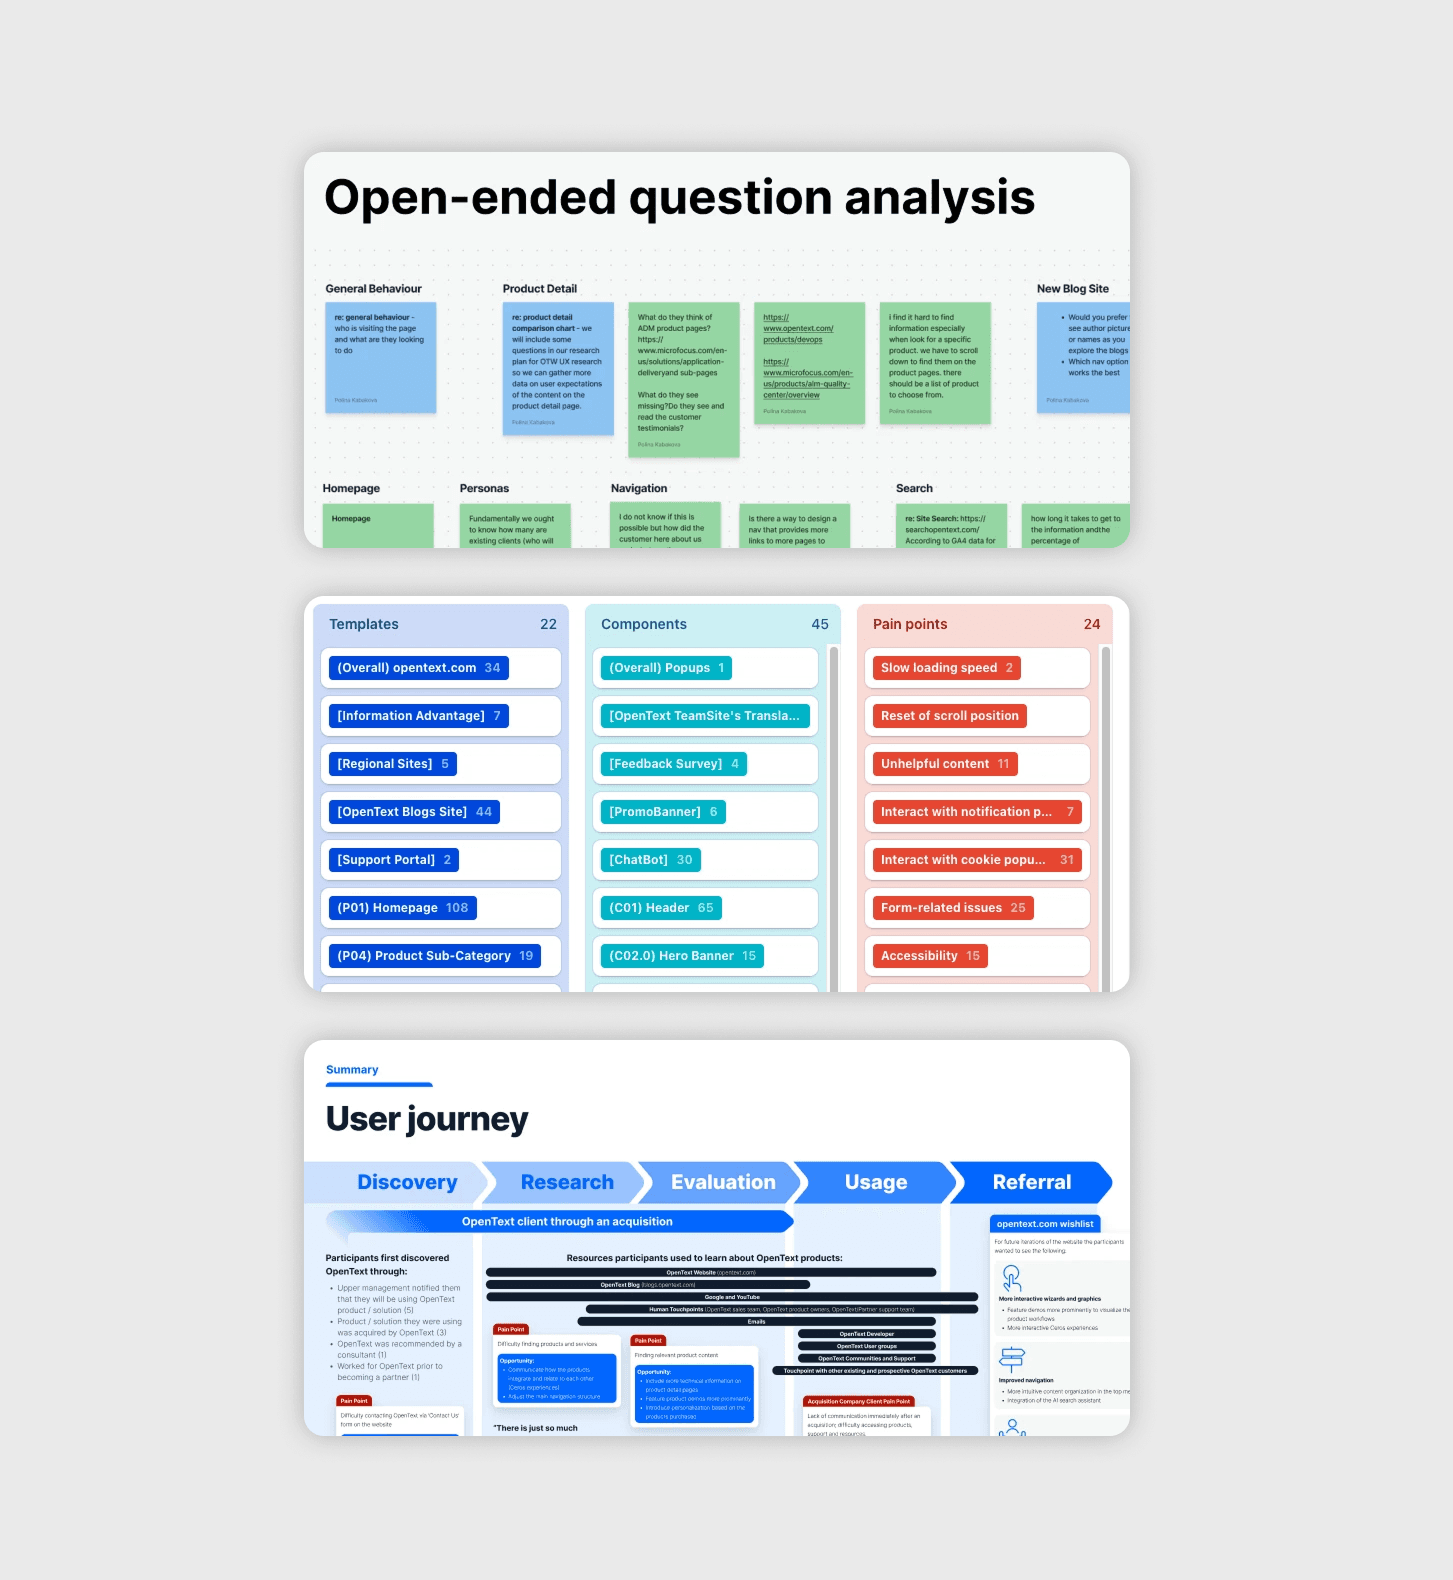
Analyzing large amounts of data to identify patterns and actionable insights.
Effectively communicating research findings to stakeholders and team members.
Maintaining objectivity and avoiding biases is essential for accurate insights.
Staying current with evolving user behaviours and technological trends is challenging.
Respecting user privacy and adhering to ethical standards.
Process
Methods:
Usability Testing Sessions
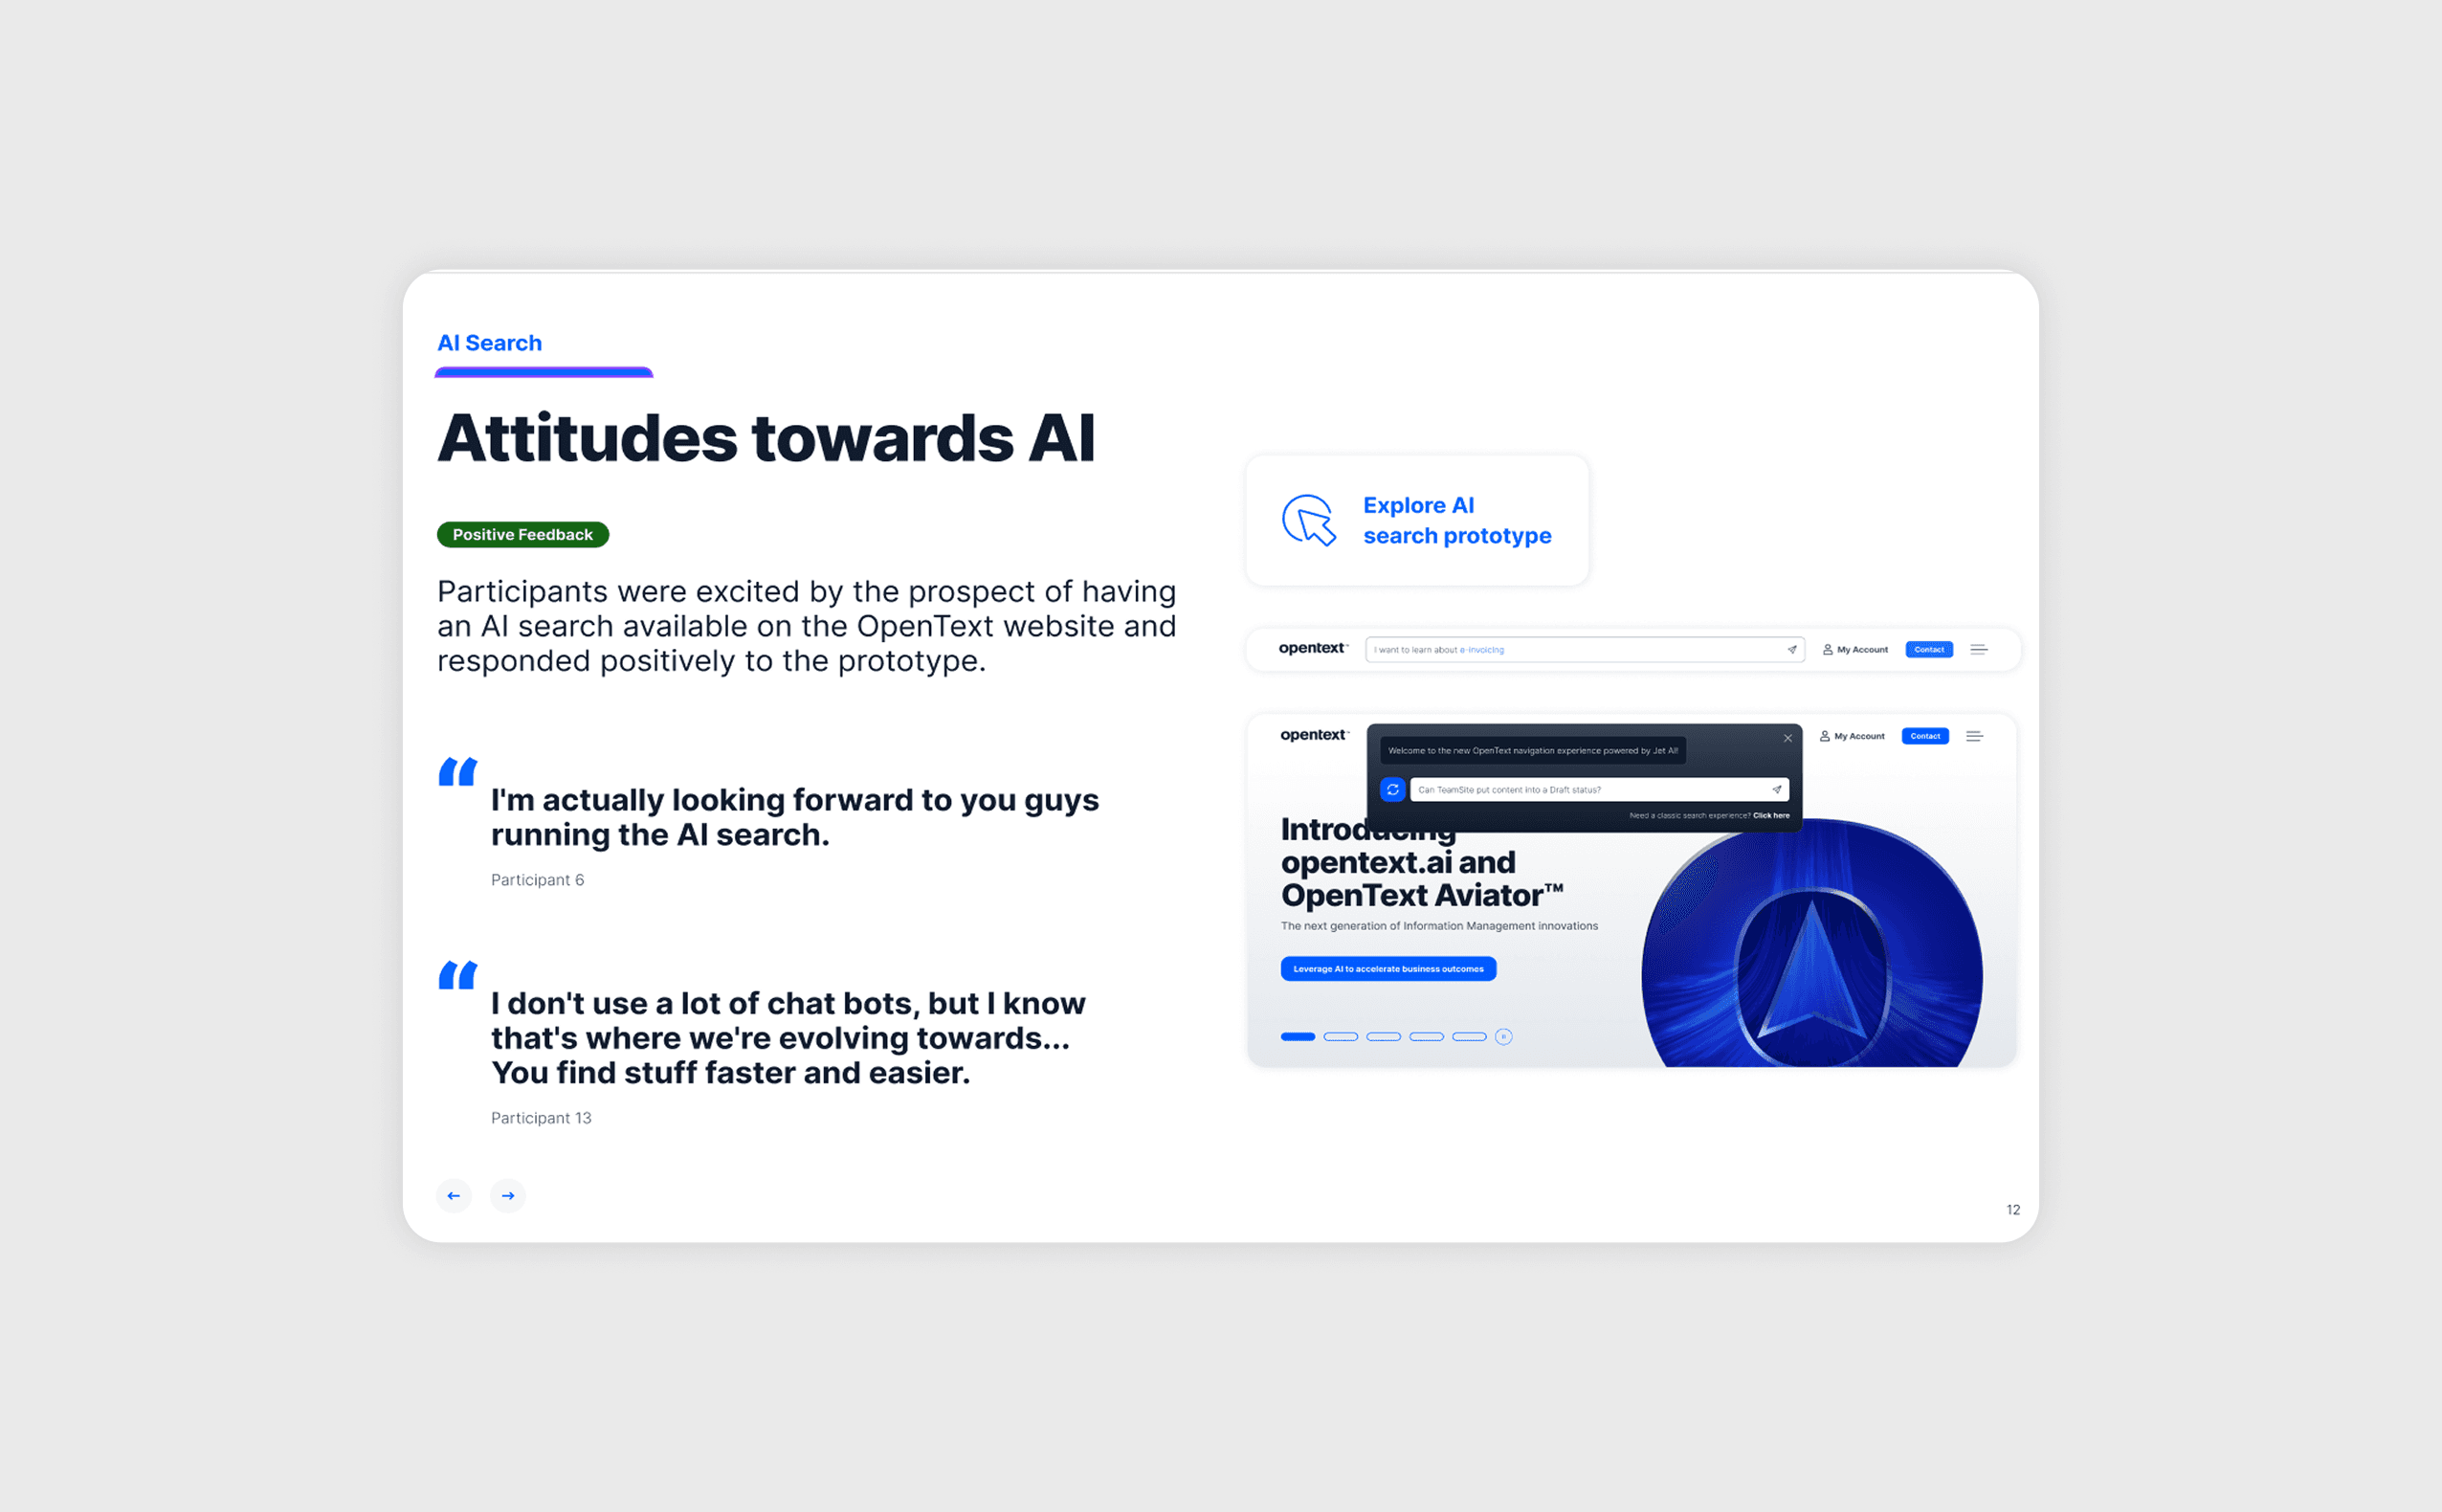
Feedback Survey
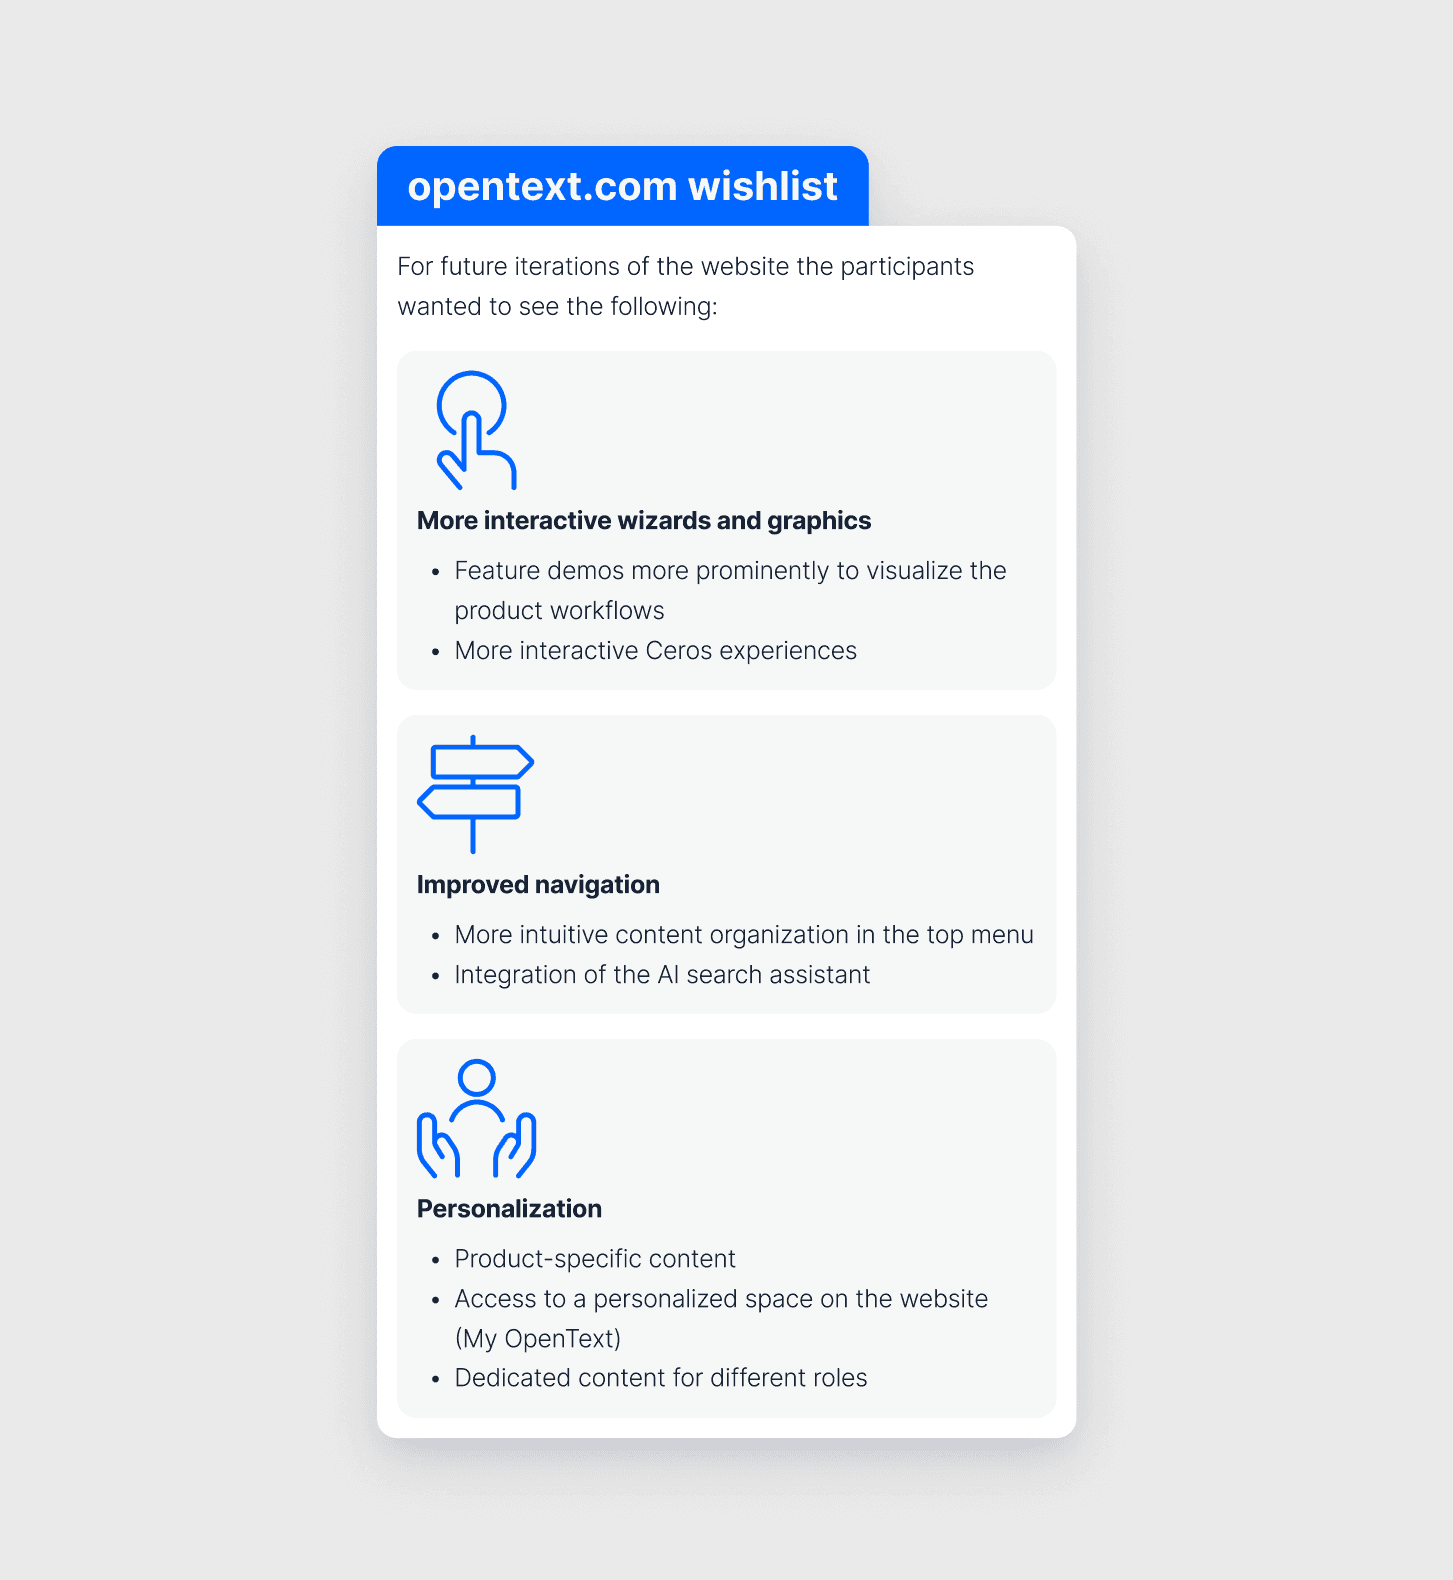
Participants were asked to share their feedback and insight during 40-minute sessions, and they were prompted to answer a short set of questions about their experience and their expectations for the future iterations of the website.
Usability Testing: We conducted usability tests with a diverse group of users to validate the design and identify areas for improvement. Based on the feedback, we were able to gather ideas for design system improvement and growth, create journey maps, personas and learn more about the brand perception.
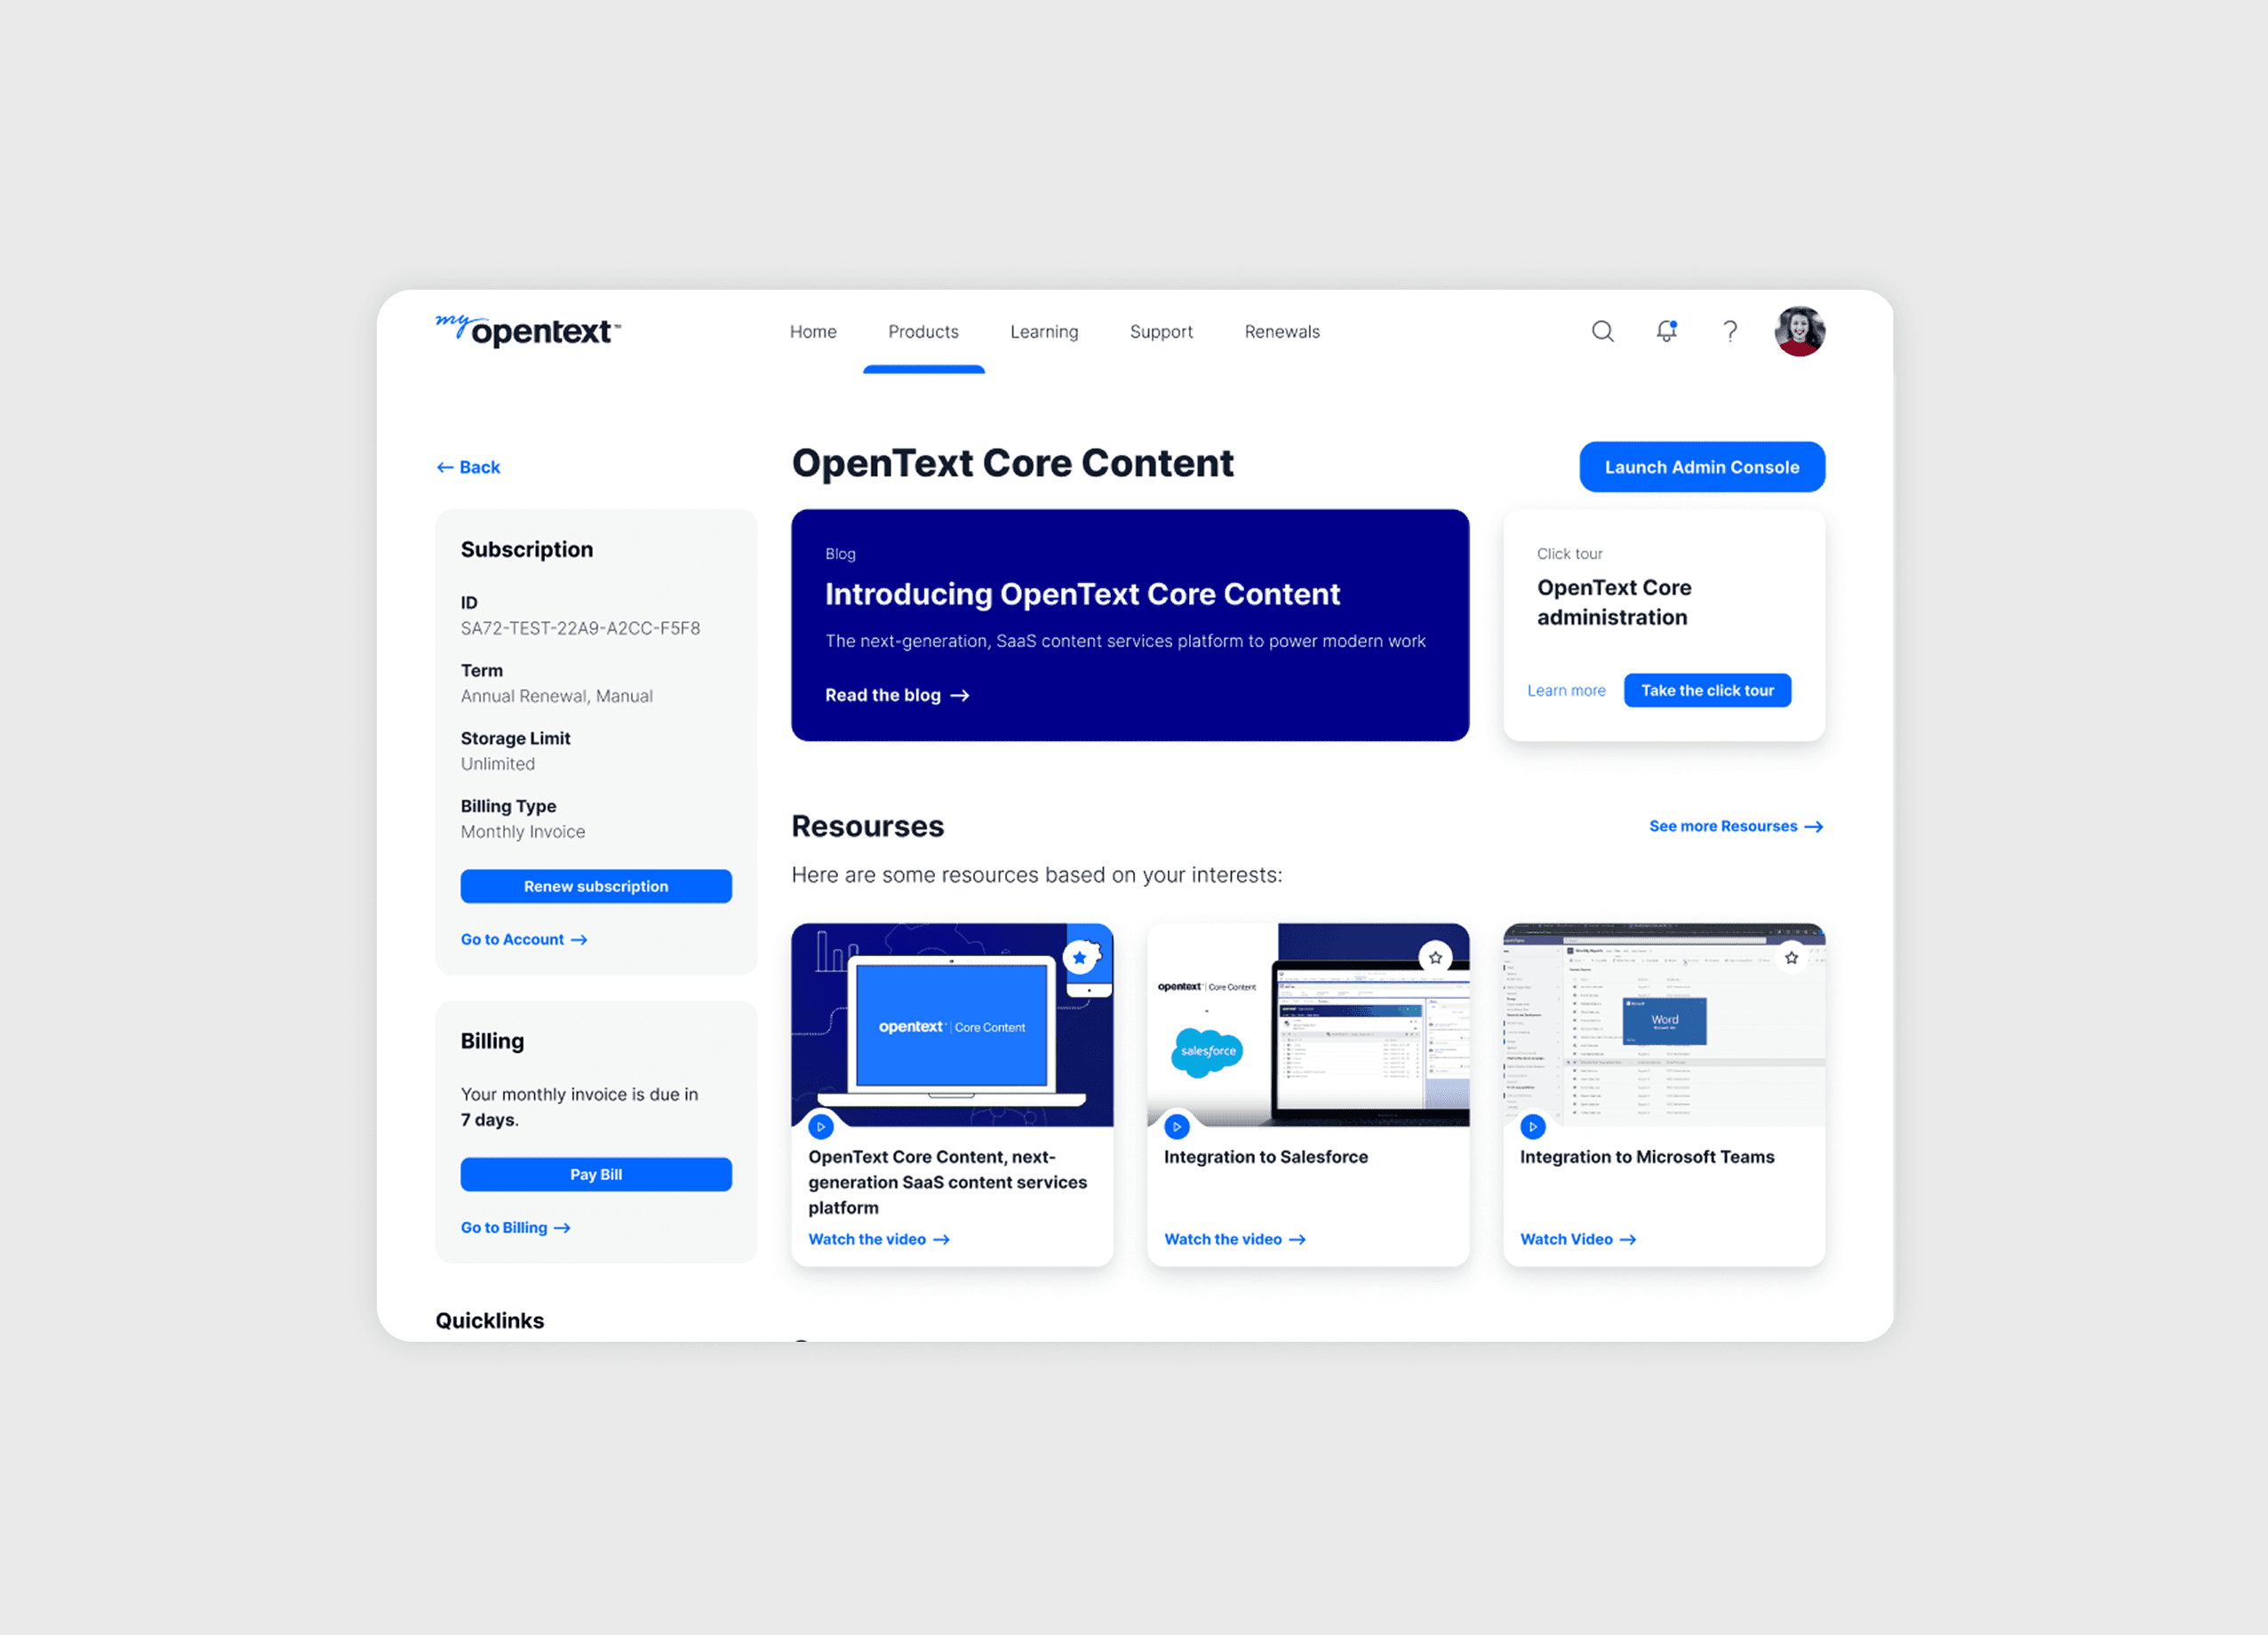
Processing the findings: Combining the analytics data using Clarity, Google Analytics, Heat maps, A/B testing with the gathered insights, we were able to execute the next phase of the website improvements.
Impact
Over 100 distinct components, 80+ page templates, and proven scalability for multiple content management systems. The post-redesign user engagement has significantly increased. User satisfaction ratings have improved from 3.2 stars to 4.3 stars. Streamlined workflows have substantially reduced page creation time.
Beside getting much clearer insights we were able to:
Identify User Needs
Enhance Usability
Improve User Satisfaction
Validate Design Decisions
Reduce Development Costs
Increase Engagement